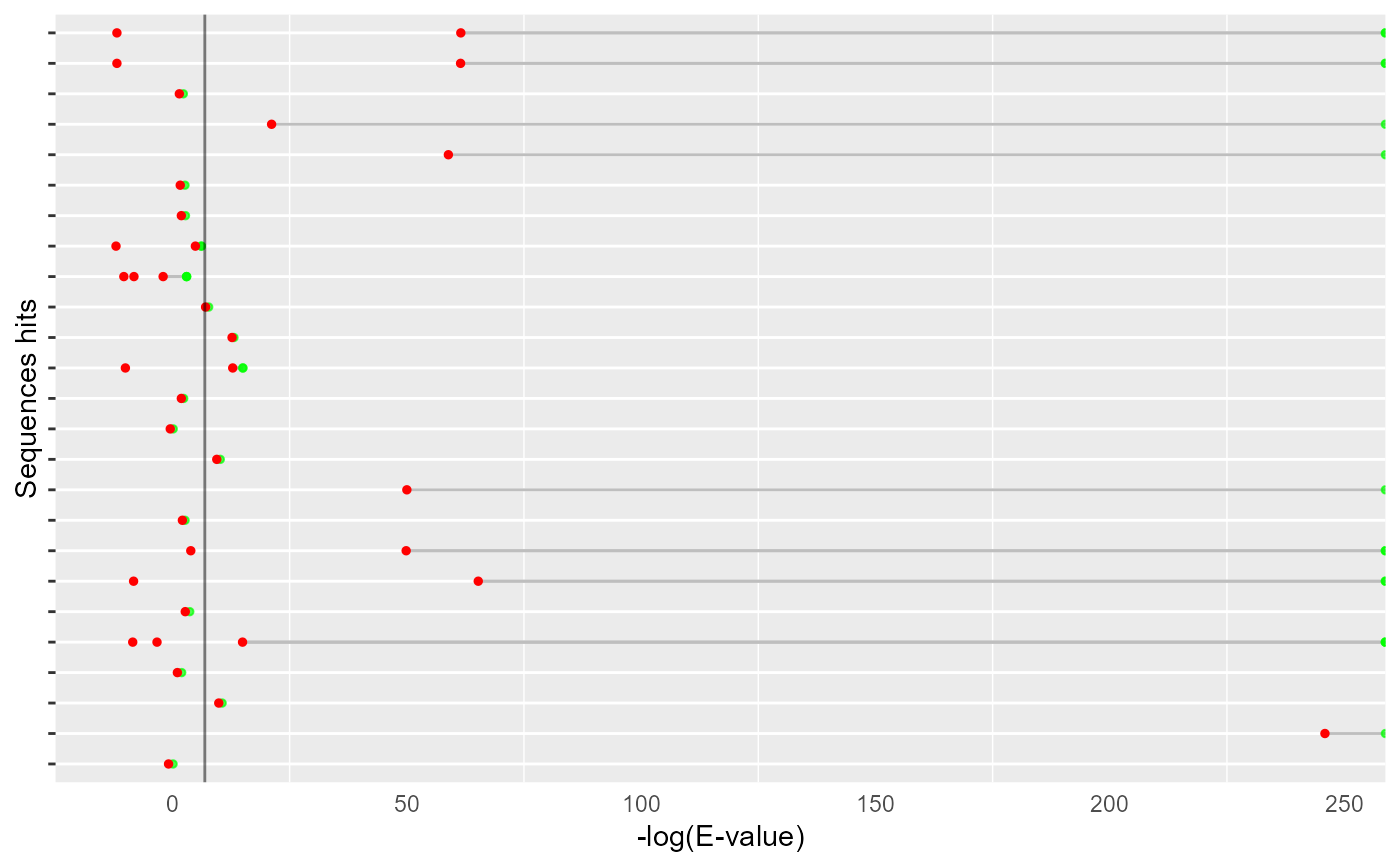
A Cleveland dot plot with the evalues of the domains and sequences.
Source:R/hmmer_evalues_cleveland_dot_plot.R
hmmer_evalues_cleveland_dot_plot.RdA Cleveland dot plot with the evalues of the domains and sequences.
hmmer_evalues_cleveland_dot_plot(data, threshold = 0.001)Arguments
- data
A Data Frame obtained with HMMERutils
- threshold
A numeric vector of one with a maximum allowed value of evalue to draw a line.
Value
A ggplot2 object.
Examples
data("phmmer_2abl")

hmmer_evalues_cleveland_dot_plot(
    phmmer_2abl,
    threshold = 0.001
)