The goal of HMMERutils is to provide a bunch of convenient functions to search for homologous sequences using the HMMER API, annotate them taxonomically, calculate physicochemical properties and facilitate exploratory analysis of homologous sequence data.
Installation instructions
We are still working on submitting this project to Bioconductor. Then, right now you can only install the development version from GitHub with:
BiocManager::install("currocam/HMMERutils")Example
This is a basic example that shows you how to solve a common problem:
library("HMMERutils")
fasta_2abl <- paste0(
    "MGPSENDPNLFVALYDFVASGDNTLSITKGEKLRVLGYNHNGEWCEAQTKNGQGW",
    "VPSNYITPVNSLEKHSWYHGPVSRNAAEYLLSSGINGSFLVRESESSPGQRSISL",
    "RYEGRVYHYRINTASDGKLYVSSESRFNTLAELVHHHSTVADGLITTLHYPAP"
)
data <- search_phmmer(seq = fasta_2abl, seqdb = "swissprot") %>%
    add_sequences_to_hmmer_tbl() %>%
    add_taxa_to_hmmer_tbl() %>%
    add_physicochemical_properties_to_HMMER_tbl()
Now, you can easily summarize the information using the well-known function from Tidyverse, integrating taxonomic information as well as theoretical protein index.
library(dplyr)
#>
#> Attaching package: 'dplyr'
#> The following objects are masked from 'package:stats':
#>
#>     filter, lag
#> The following objects are masked from 'package:base':
#>
#>     intersect, setdiff, setequal, union
data %>%
    filter(hits.evalue > 10^-5) %>%
    distinct(hits.fullfasta, .keep_all = TRUE) %>%
    group_by(taxa.phylum) %>%
    summarise(
        n = n(),
        "Molecular.Weight" = mean(properties.molecular.weight, na.rm = TRUE)
    )
#> # A tibble: 7 × 3
#>   taxa.phylum        n Molecular.Weight
#>   <chr>          <int>            <dbl>
#> 1 Arthropoda         2          197779.
#> 2 Artverviricota     3           71266.
#> 3 Ascomycota        19          126362.
#> 4 Basidiomycota      1          139552.
#> 5 Chordata          71           77001.
#> 6 Evosea             3          102576.
#> 7 Nematoda           6           55944.
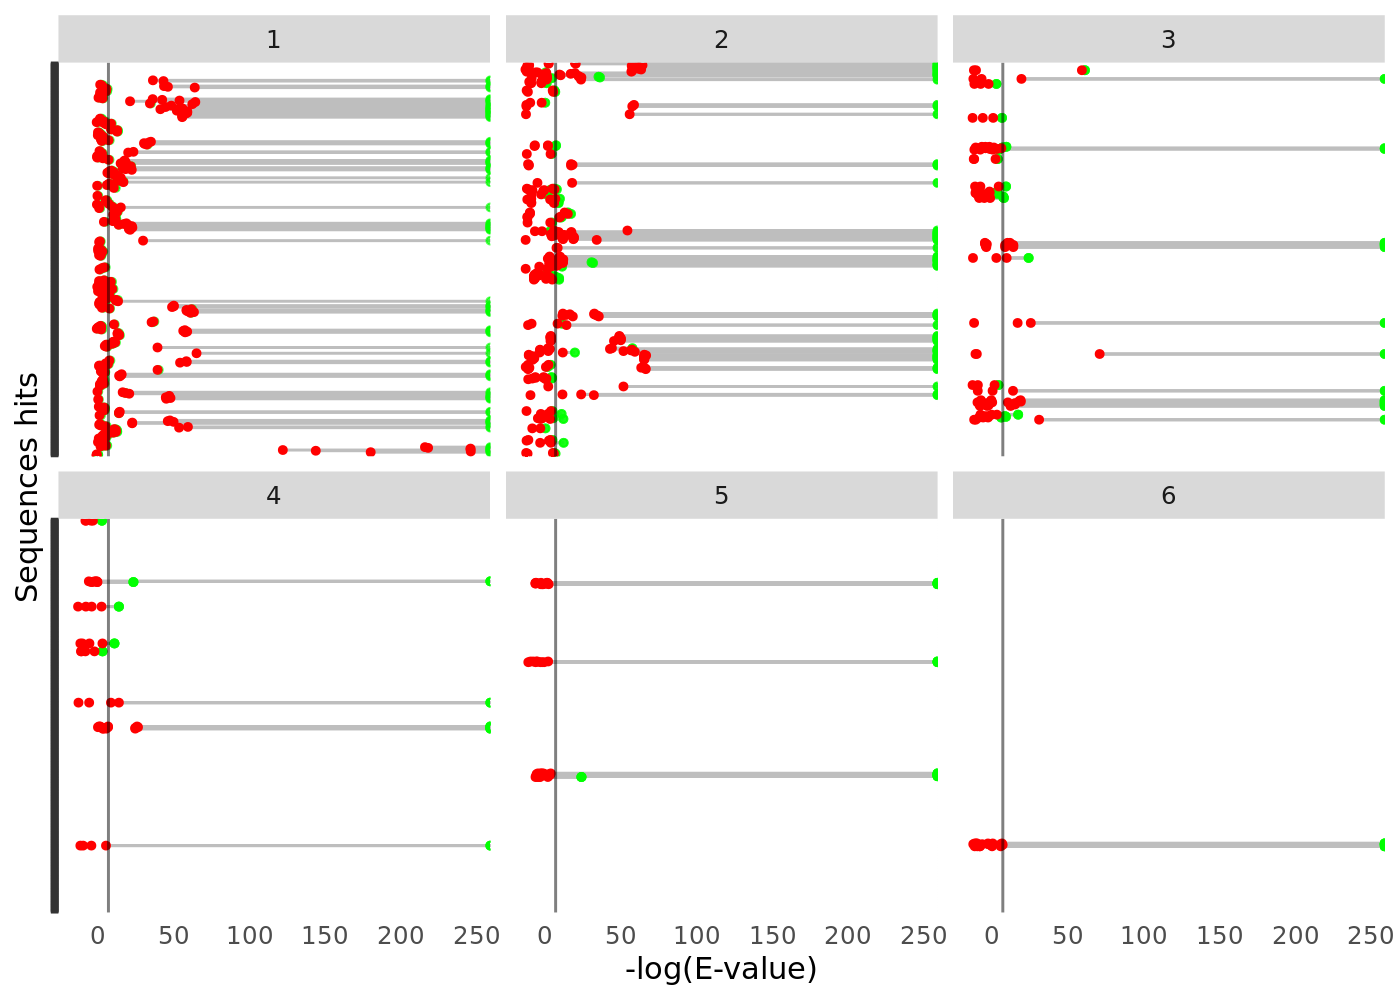
You can take advantage of this library and ggplot2to visualize how your expected values (per sequence and domain) are distributed and how it is related to the architecture of the protein.
library(ggplot2)
hmmer_evalues_cleveland_dot_plot(data) +
    ggplot2::facet_wrap(~hits.ndom)
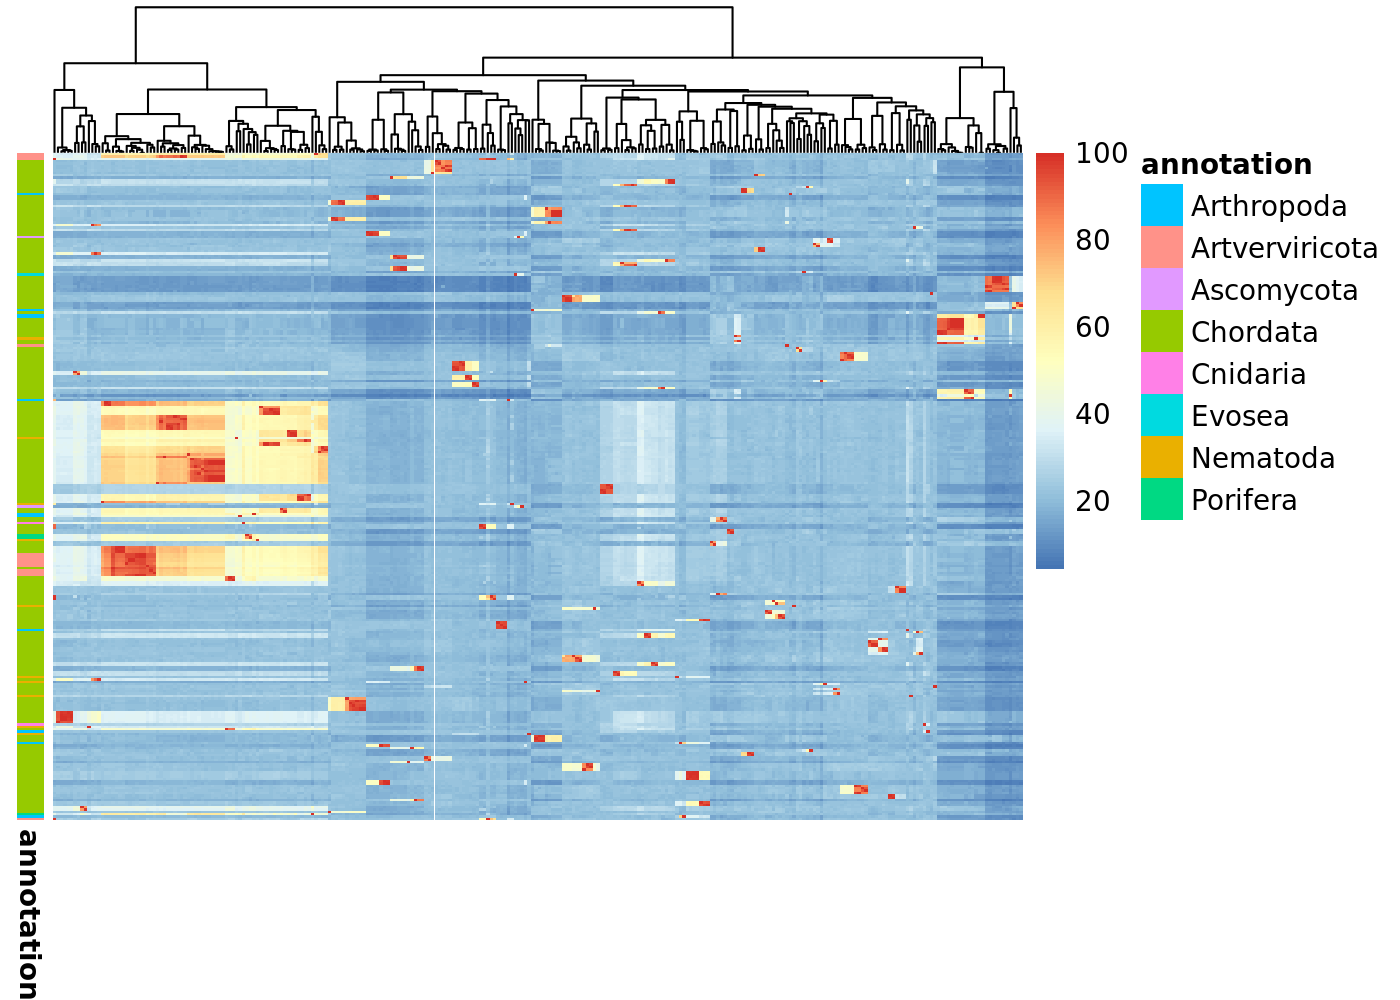
And use some handy functions to even cluster your sequences based on their pairwise identity and visualize it as a heat map. In the following chunk of code we are:
- Filtering the sequences based on the E-value of the best scoring domain, instead of the E-value of the whole sequence.
- Calculating the pairwise sequence identity.
- Visualize the resulting matrix as a heat map, annotating it using taxonomic information.
filtered <- filter_hmmer(data, by = "domains.ievalue")
pairwise_identities <- pairwise_alignment_sequence_identity(filtered$hits.fullfasta)
#> Warning in check_seqs(seqs): 'seqs' has no names or some names are NA
pairwise_sequence_identity_heatmap(pairwise_identities, filtered$hits.ph)
Citation
Below is the citation output from using citation('HMMERutils') in R. Please run this yourself to check for any updates on how to cite HMMERutils.
Please note that the HMMERutils package was only made possible thanks to many other R and bioinformatics software authors, which are cited either in the vignettes and/or the paper(s) describing this package.
Code of Conduct
Please note that the HMMERutils project is released with a Contributor Code of Conduct. By contributing to this project, you agree to abide by its terms.
Development tools
- Continuous code testing is possible thanks to GitHub actions through usethis, remotes, and rcmdcheck customized to use Bioconductor’s docker containers and BiocCheck.
- Code coverage assessment is possible thanks to codecov and covr.
- The documentation website is automatically updated thanks to pkgdown.
- The code is styled automatically thanks to styler.
- The documentation is formatted thanks to devtools and roxygen2.


