Plot a heatmap with the pairwise identity percentages.
Source:R/pairwise_alignment.R
pairwise_sequence_identity_heatmap.RdPlot a heatmap with the pairwise identity percentages.
pairwise_sequence_identity_heatmap(data, annotation = NULL)Arguments
- data
A Data Frame obtained from pairwise_alignment_sequence_identity.
- annotation
A character vector with as many elements as sequences.
Value
A ggplot object
Examples
data(phmmer_2abl)
pairwise_alignment_sequence_identity(
seqs = phmmer_2abl$hits.fullfasta[6:10],
aln_type = "overlap",
pid_type = "PID2"
) %>%
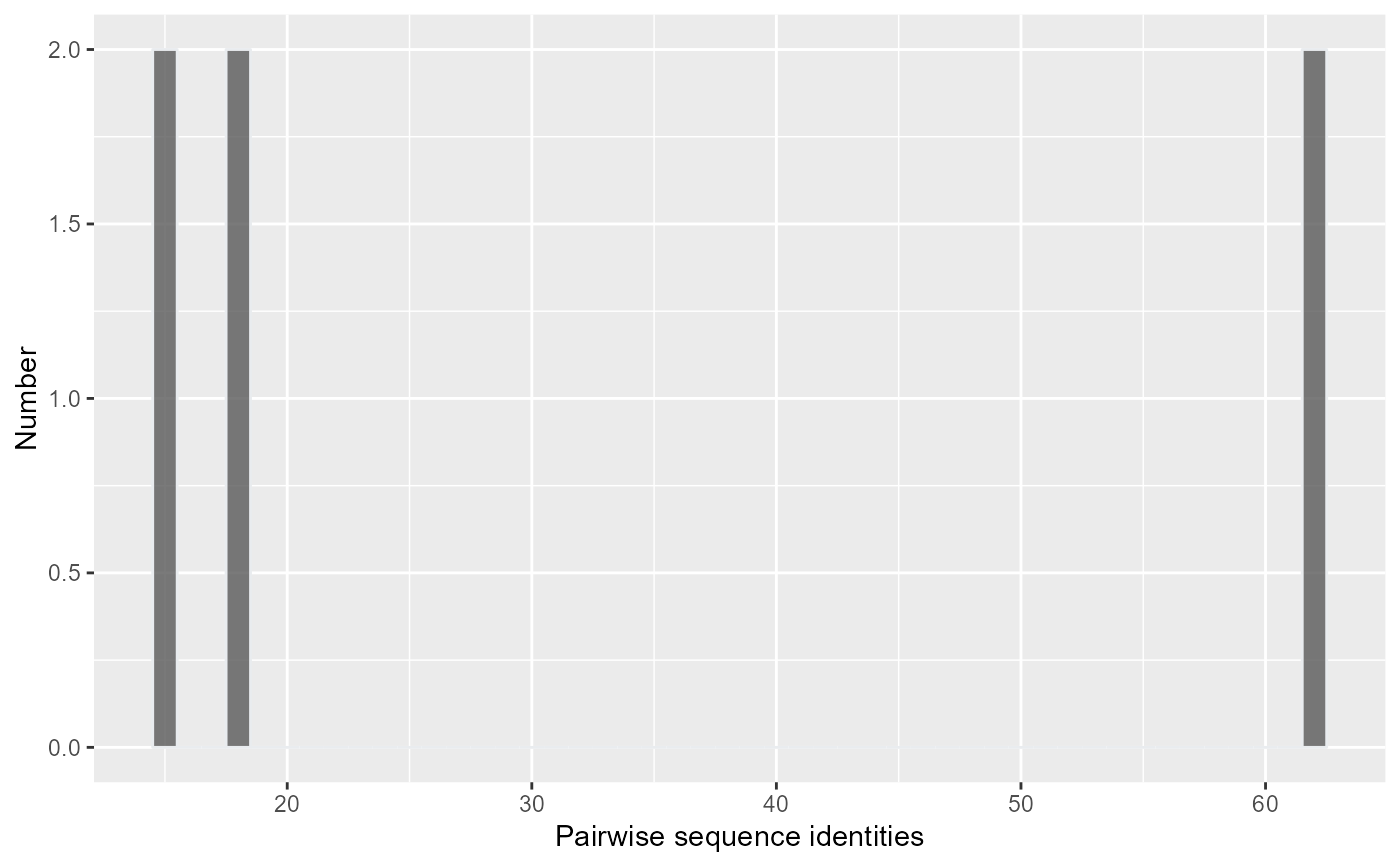
pairwise_sequence_identity_histogram()
#> Warning: Removed 14 rows containing non-finite values (`stat_bin()`).